 Welcome to SpotMAX!
Multi-dimensional microscopy data analysis
Written in Python 3 by Francesco Padovani
![]() Source code on GitHub
Source code on GitHub
Here you will find all you need to master our tool!
If you need to analyse fluorescence microscopy data you are probably in the right place.
SpotMAX will help you with these two tasks:
Detect and quantify globular-like structures (a.k.a. “spots”)
Segment and quantify fluorescently labelled structures (e.g., mitochondria, nucelus, etc.)
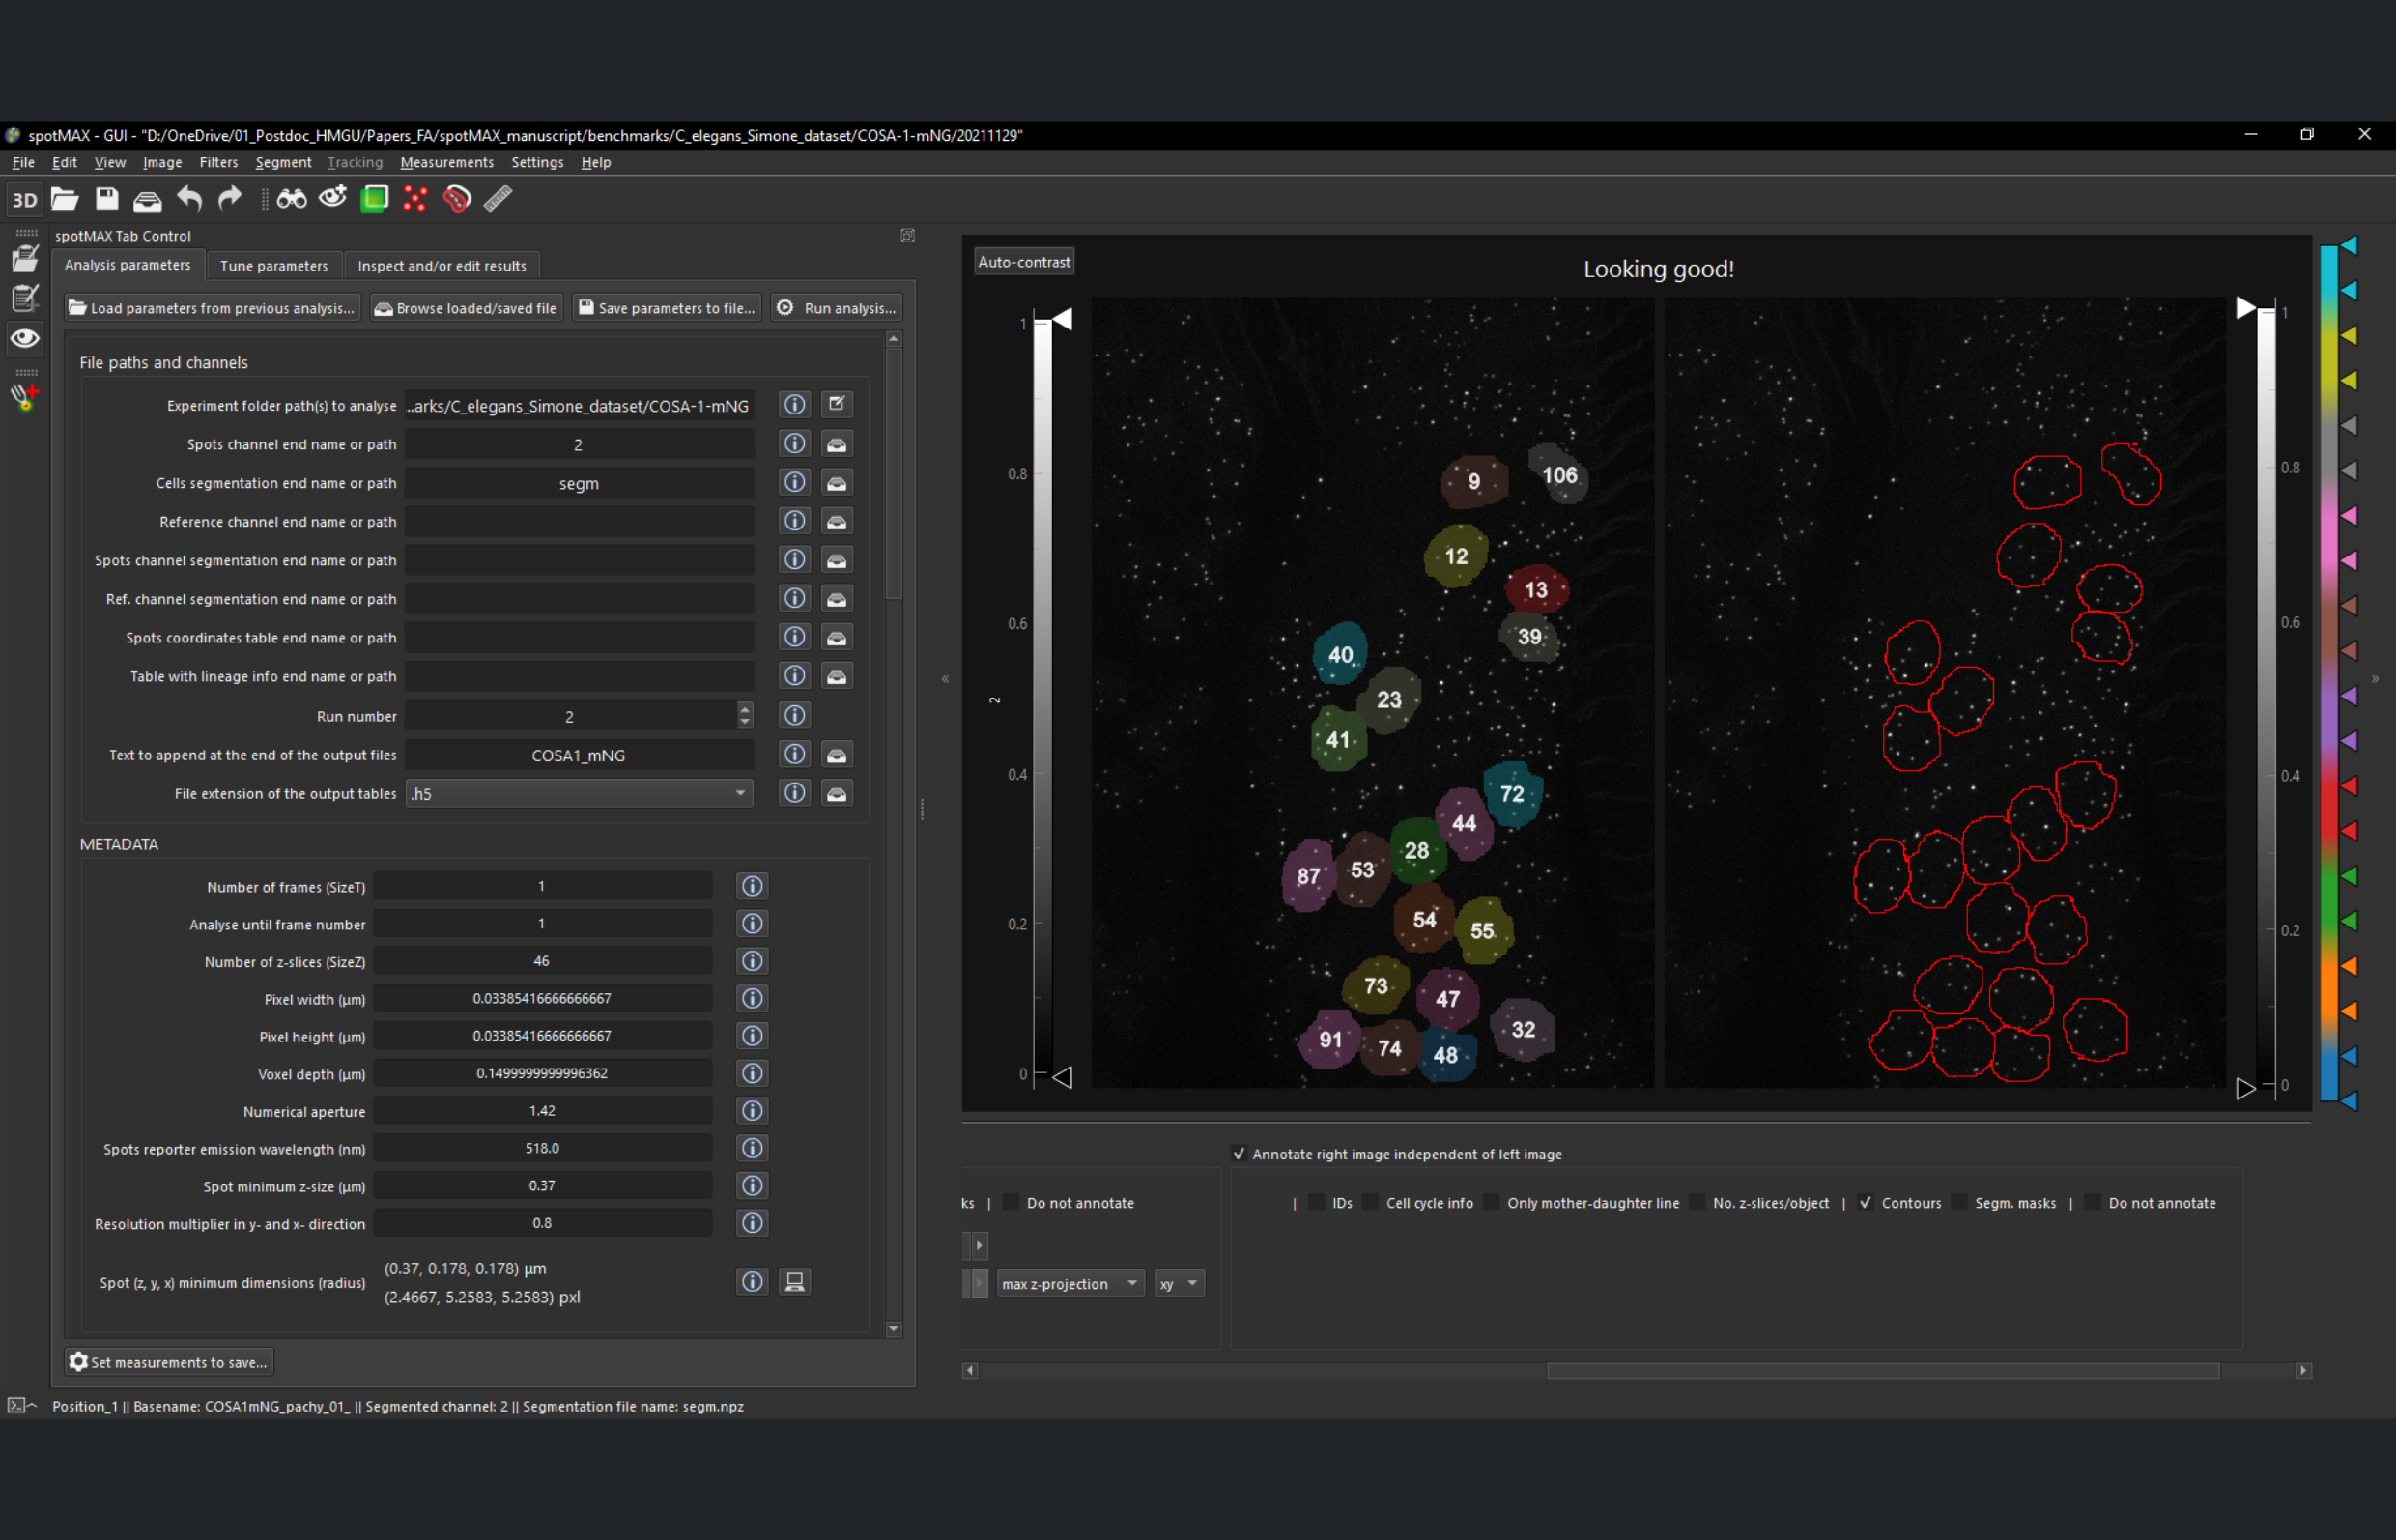
Graphical User Interface
Interactively set the analysis parameters
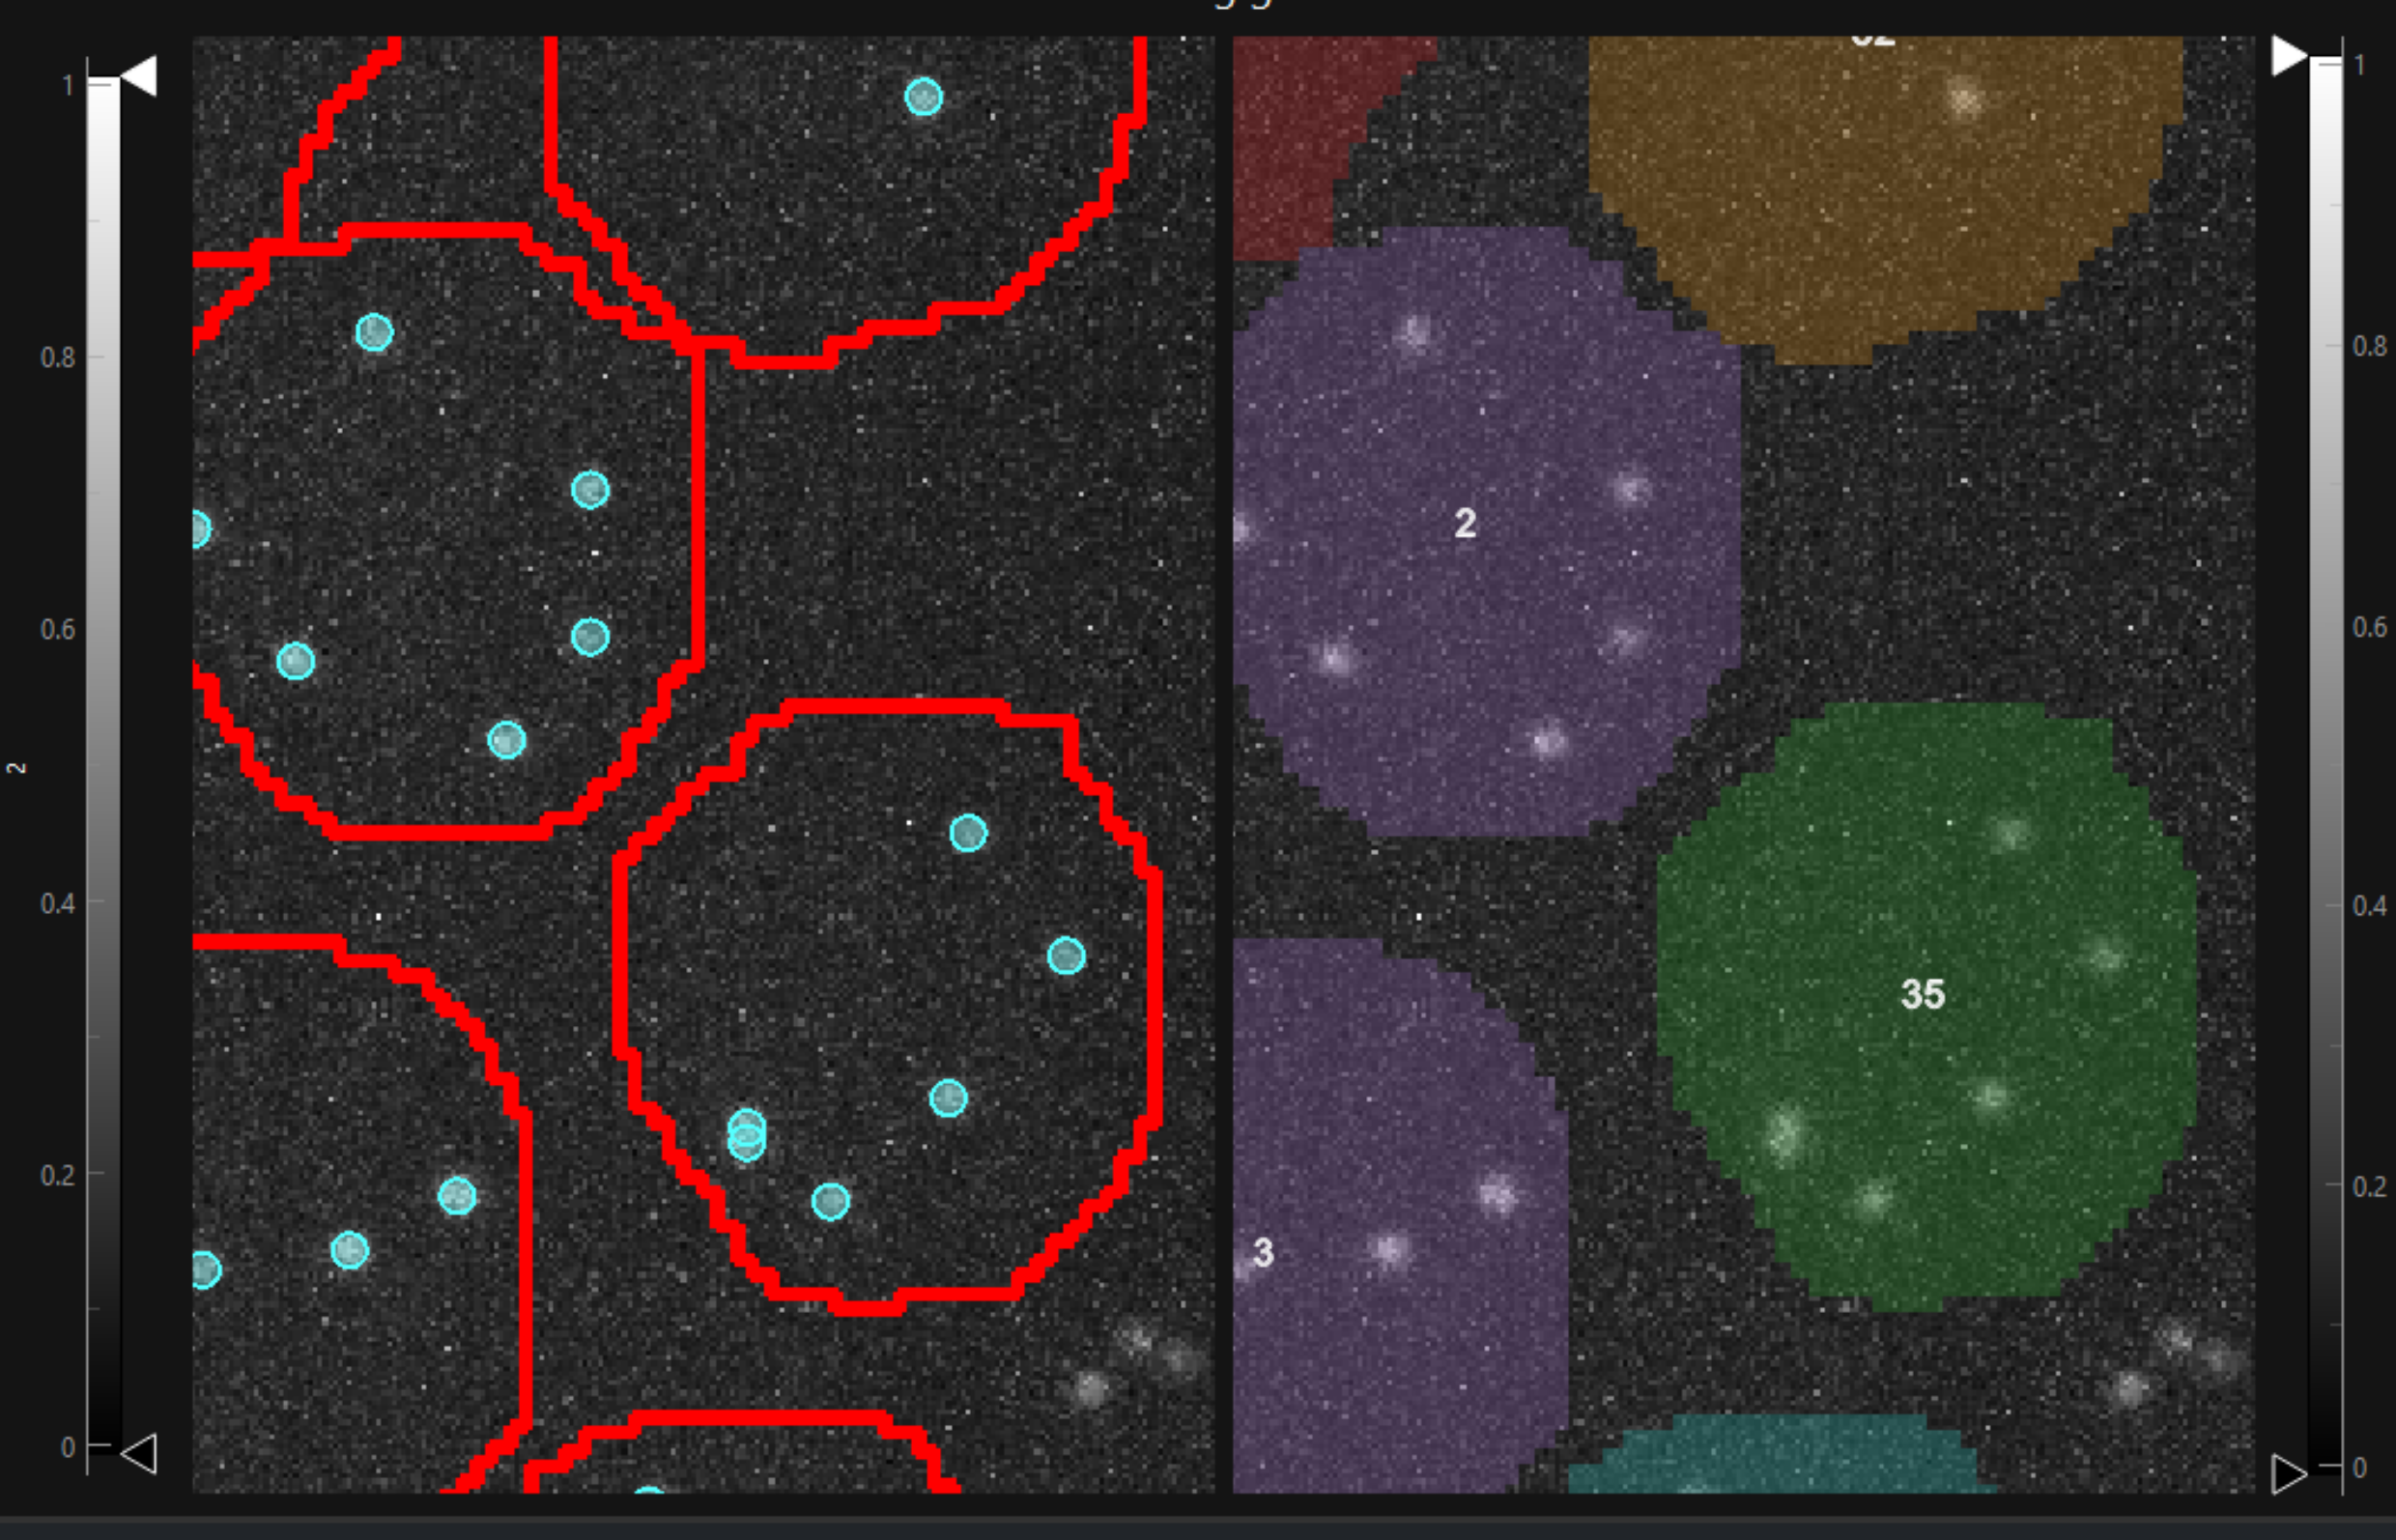
Synaptonemal Complex in C. elegans
Accurately detect touching spots
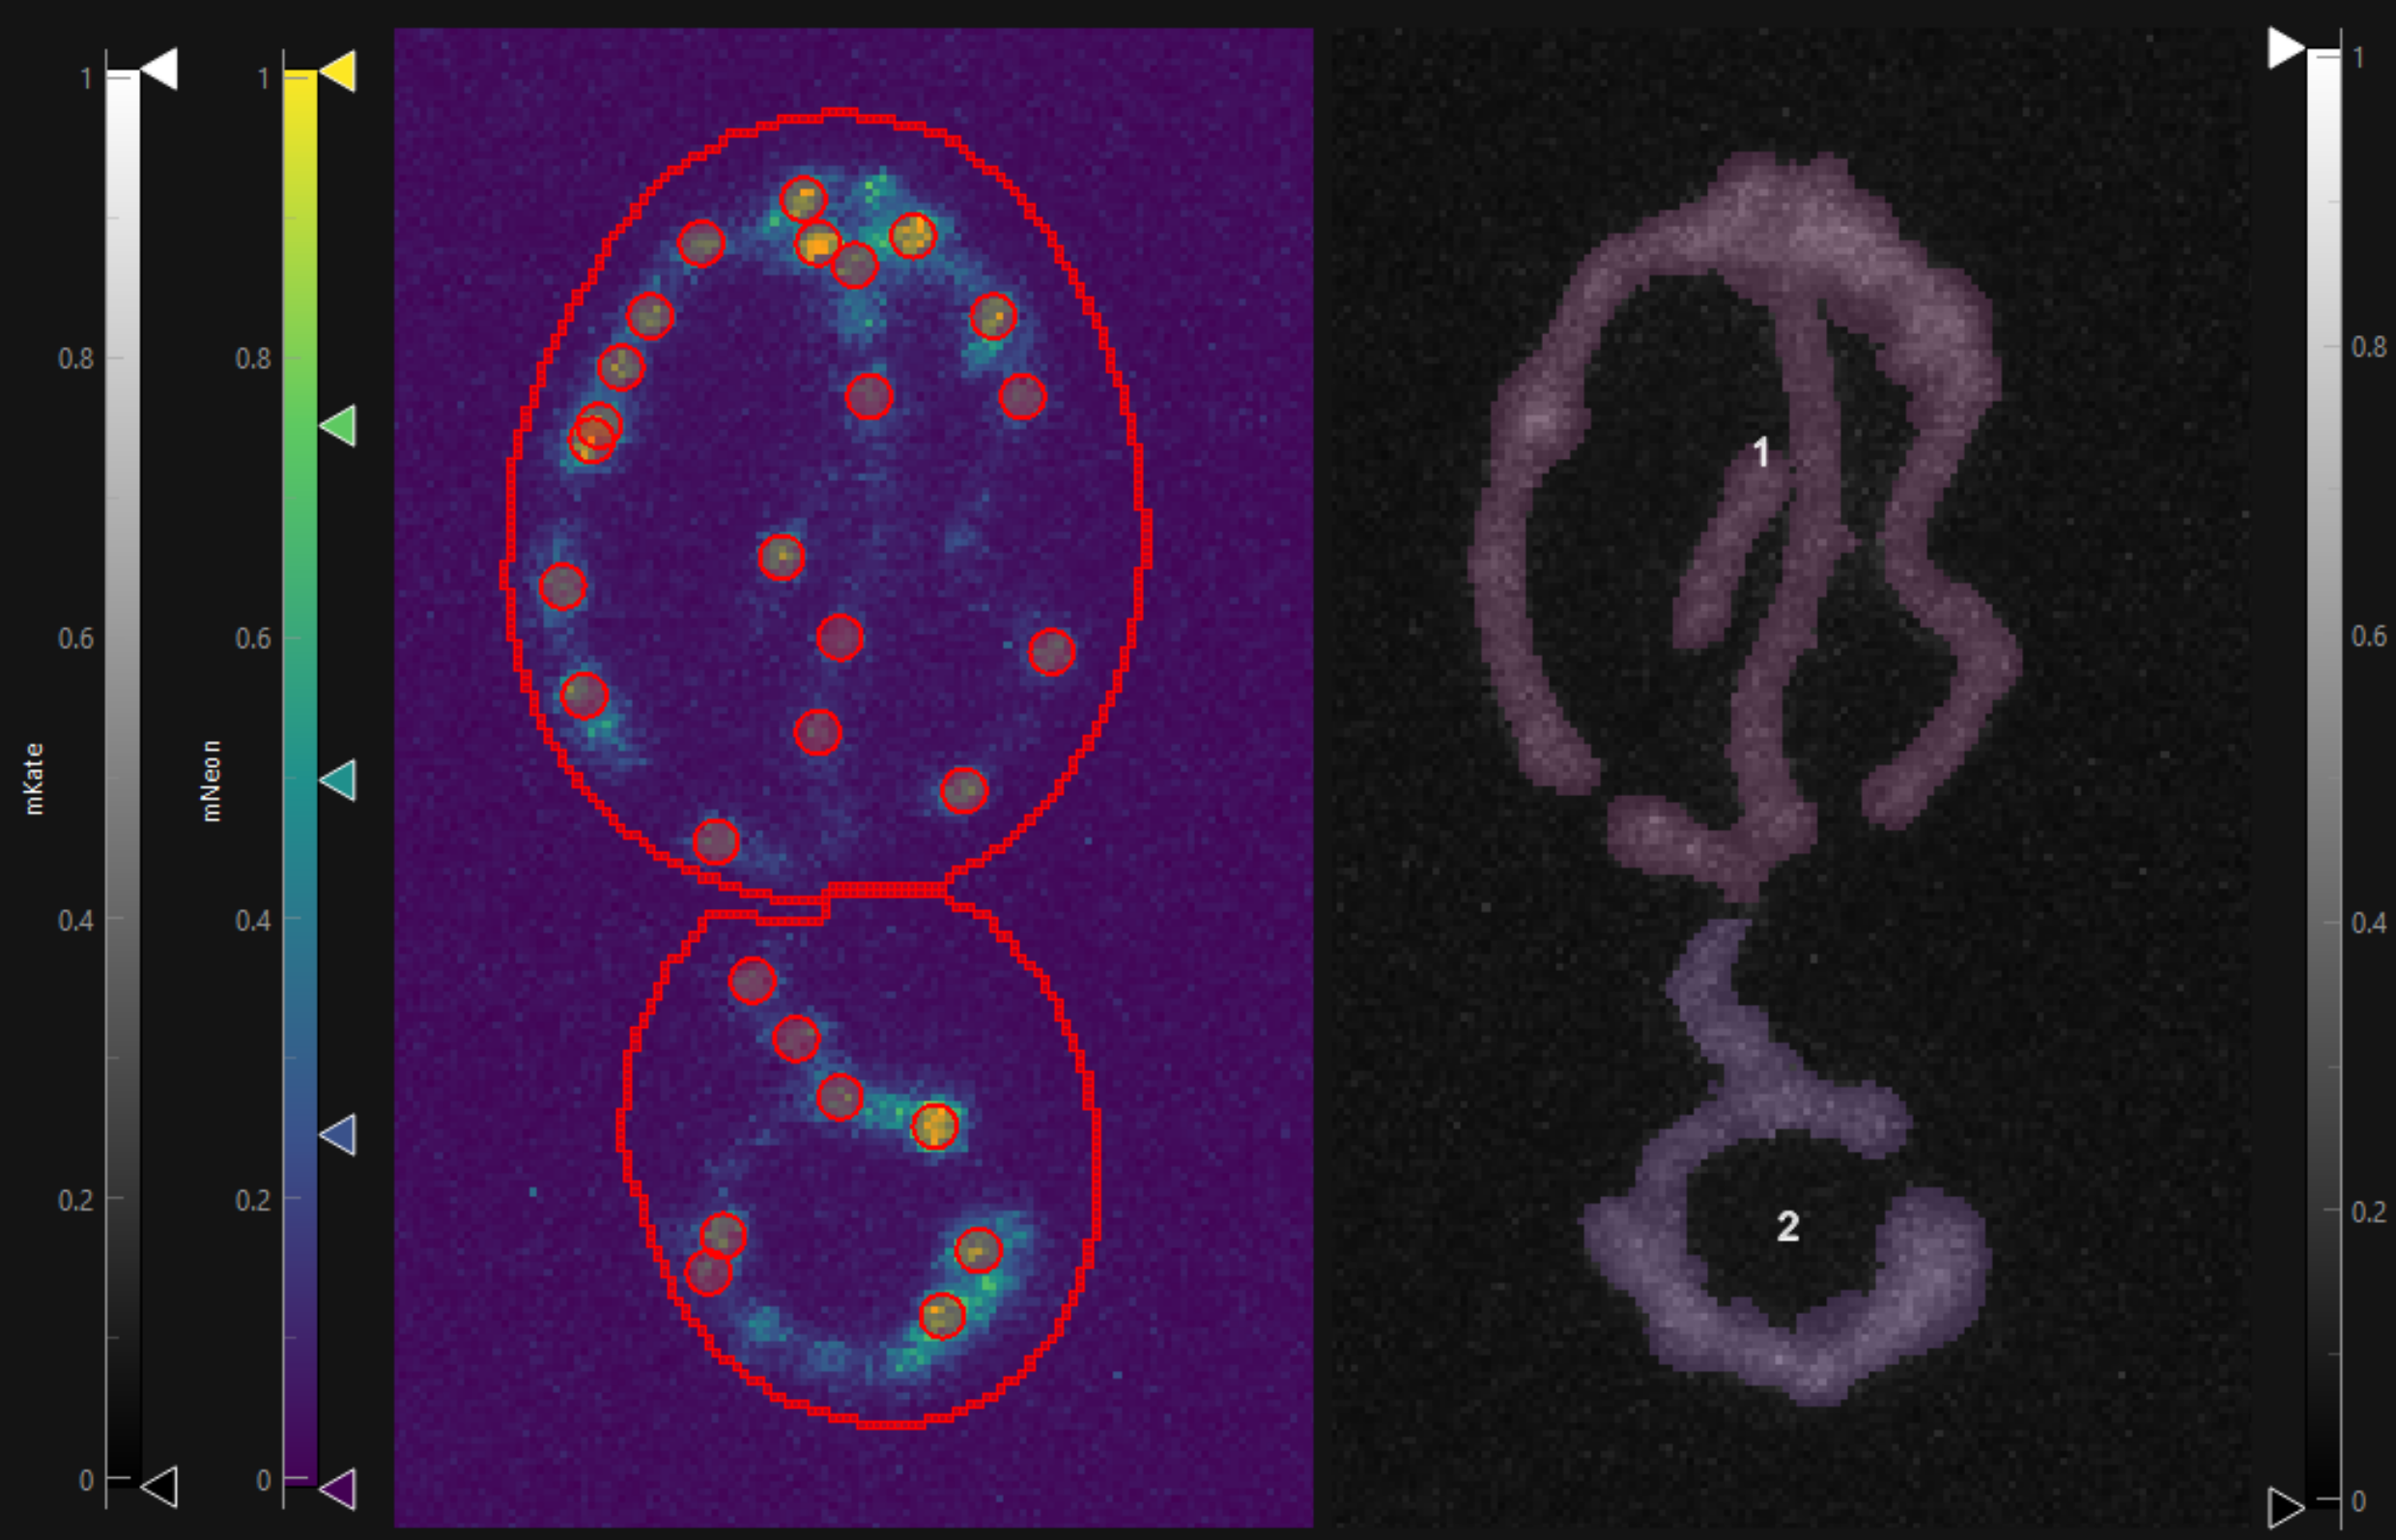
Detect spots and segment a reference channel
Segment and quantify the mitochondrial network in 3D
Telomeres length quantification in stem cells (DNA-FISH)
Quantify telomeres length as a function of cell size
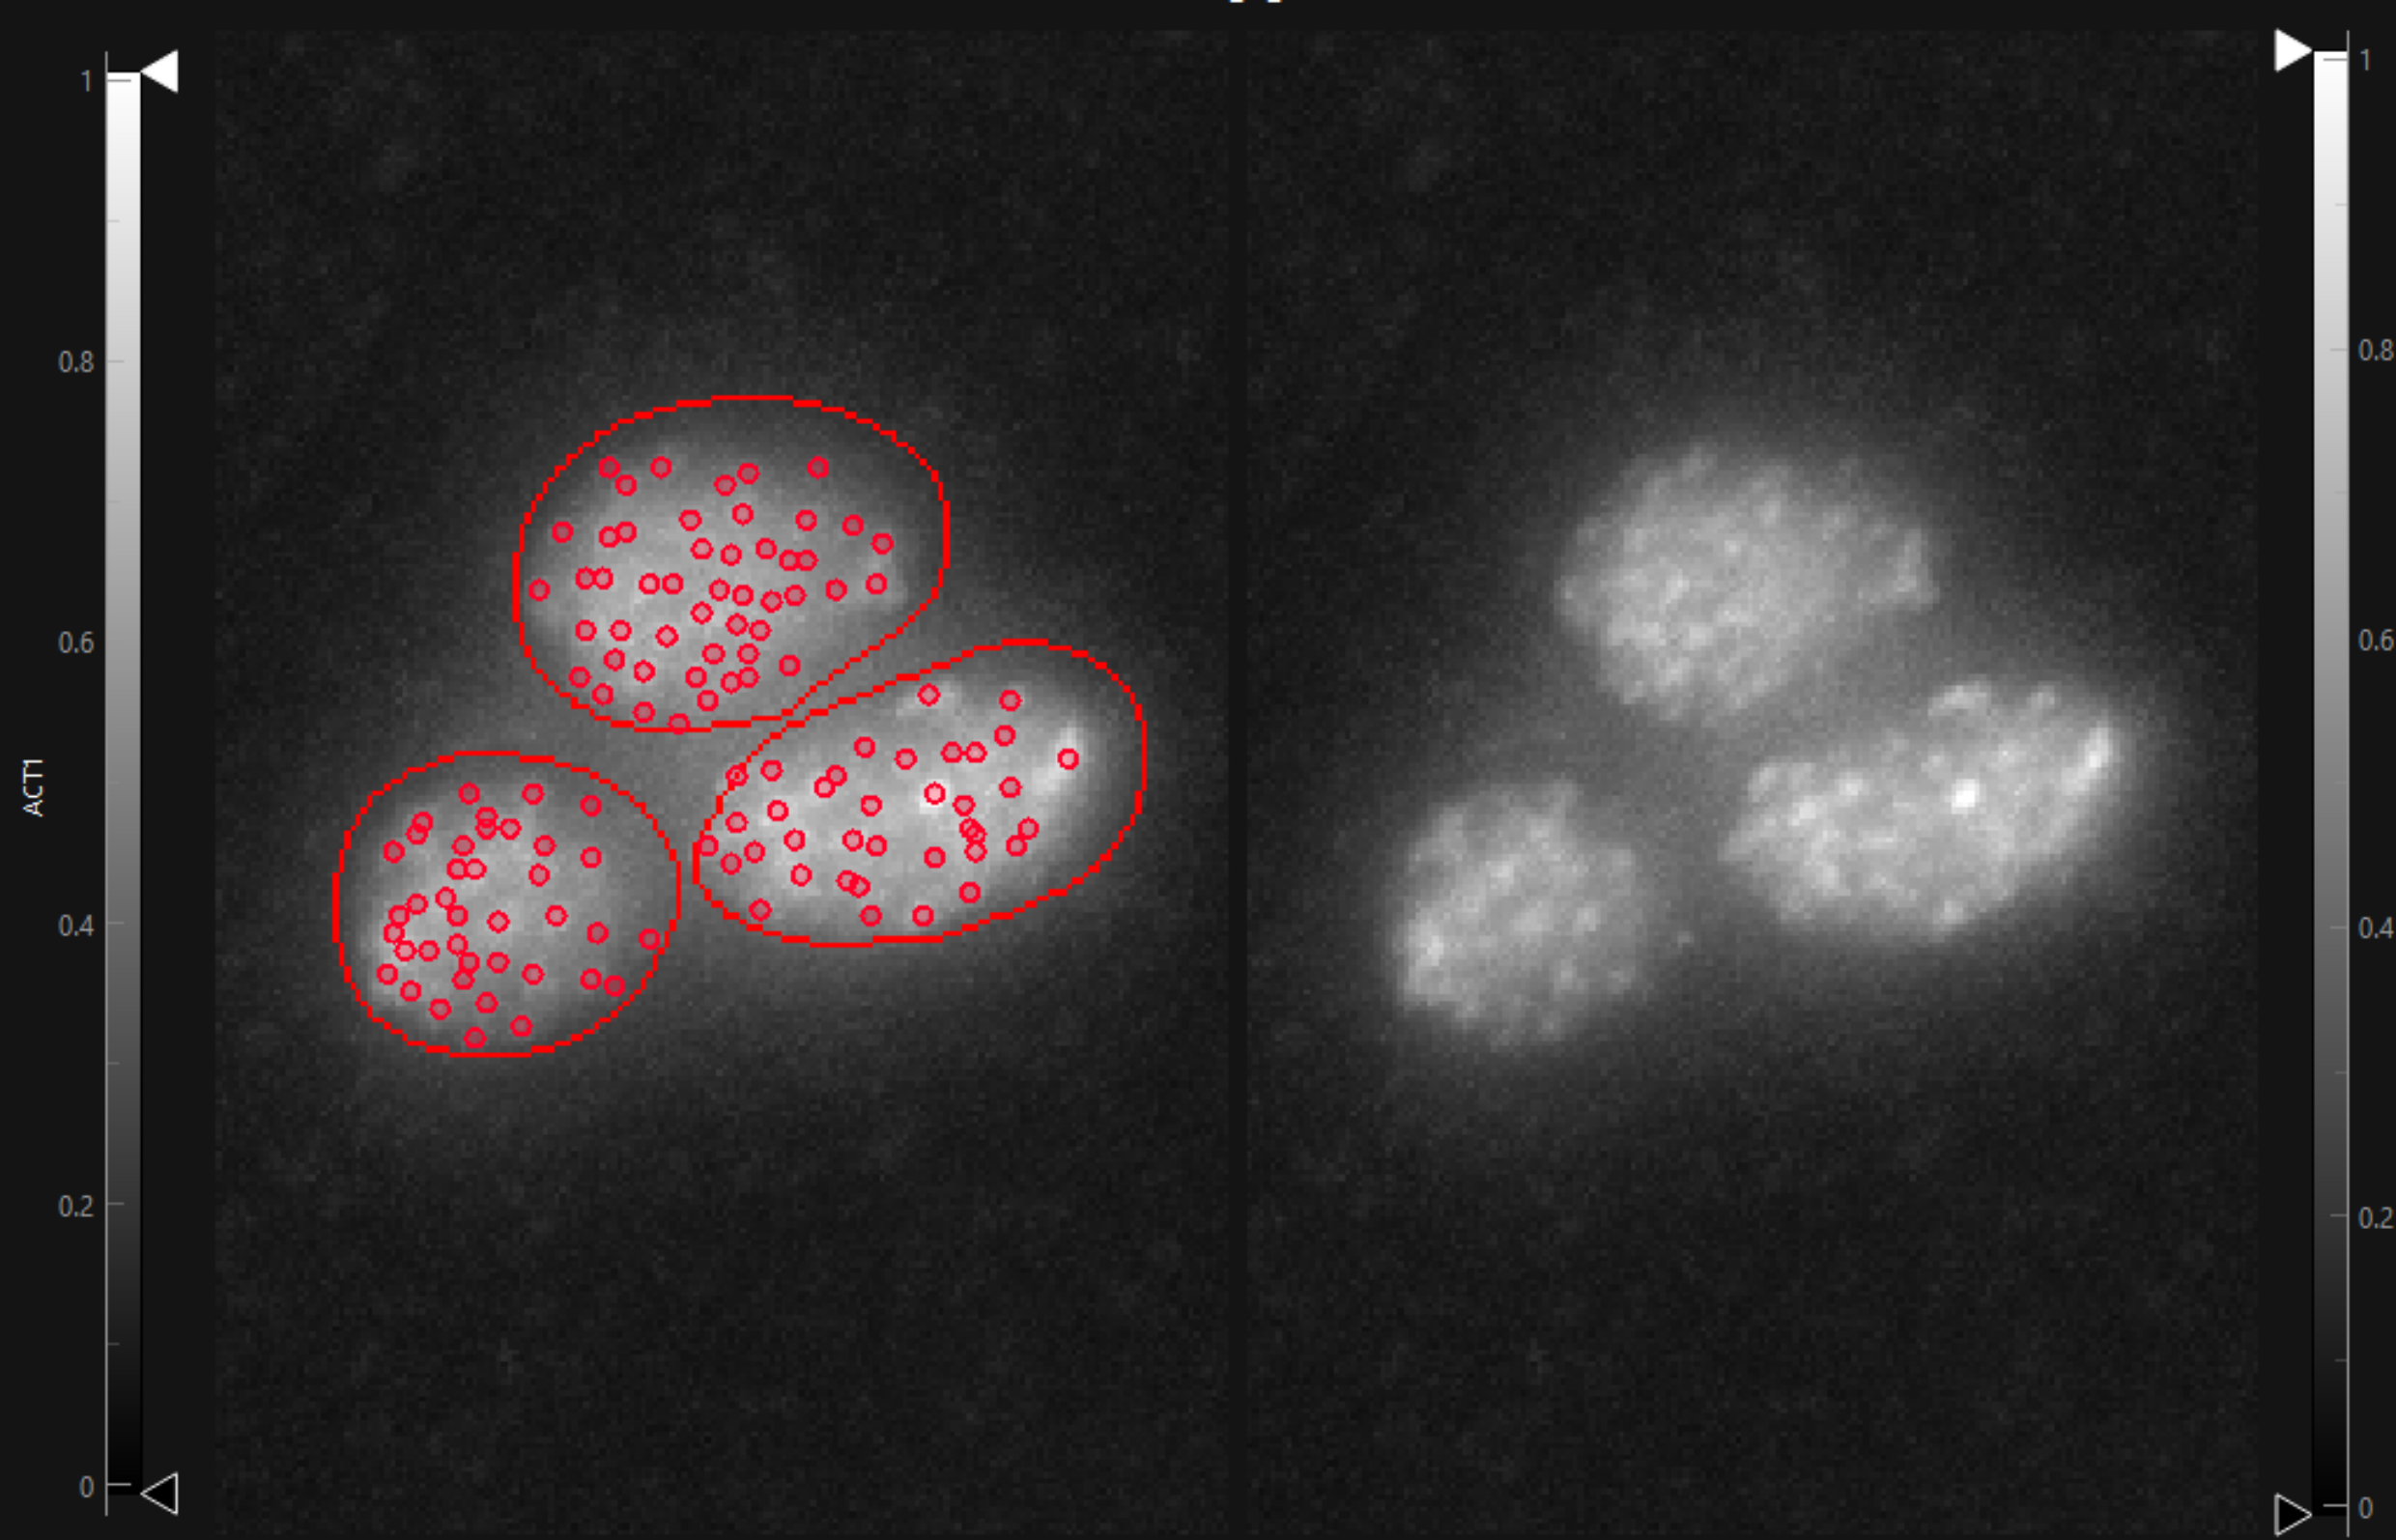
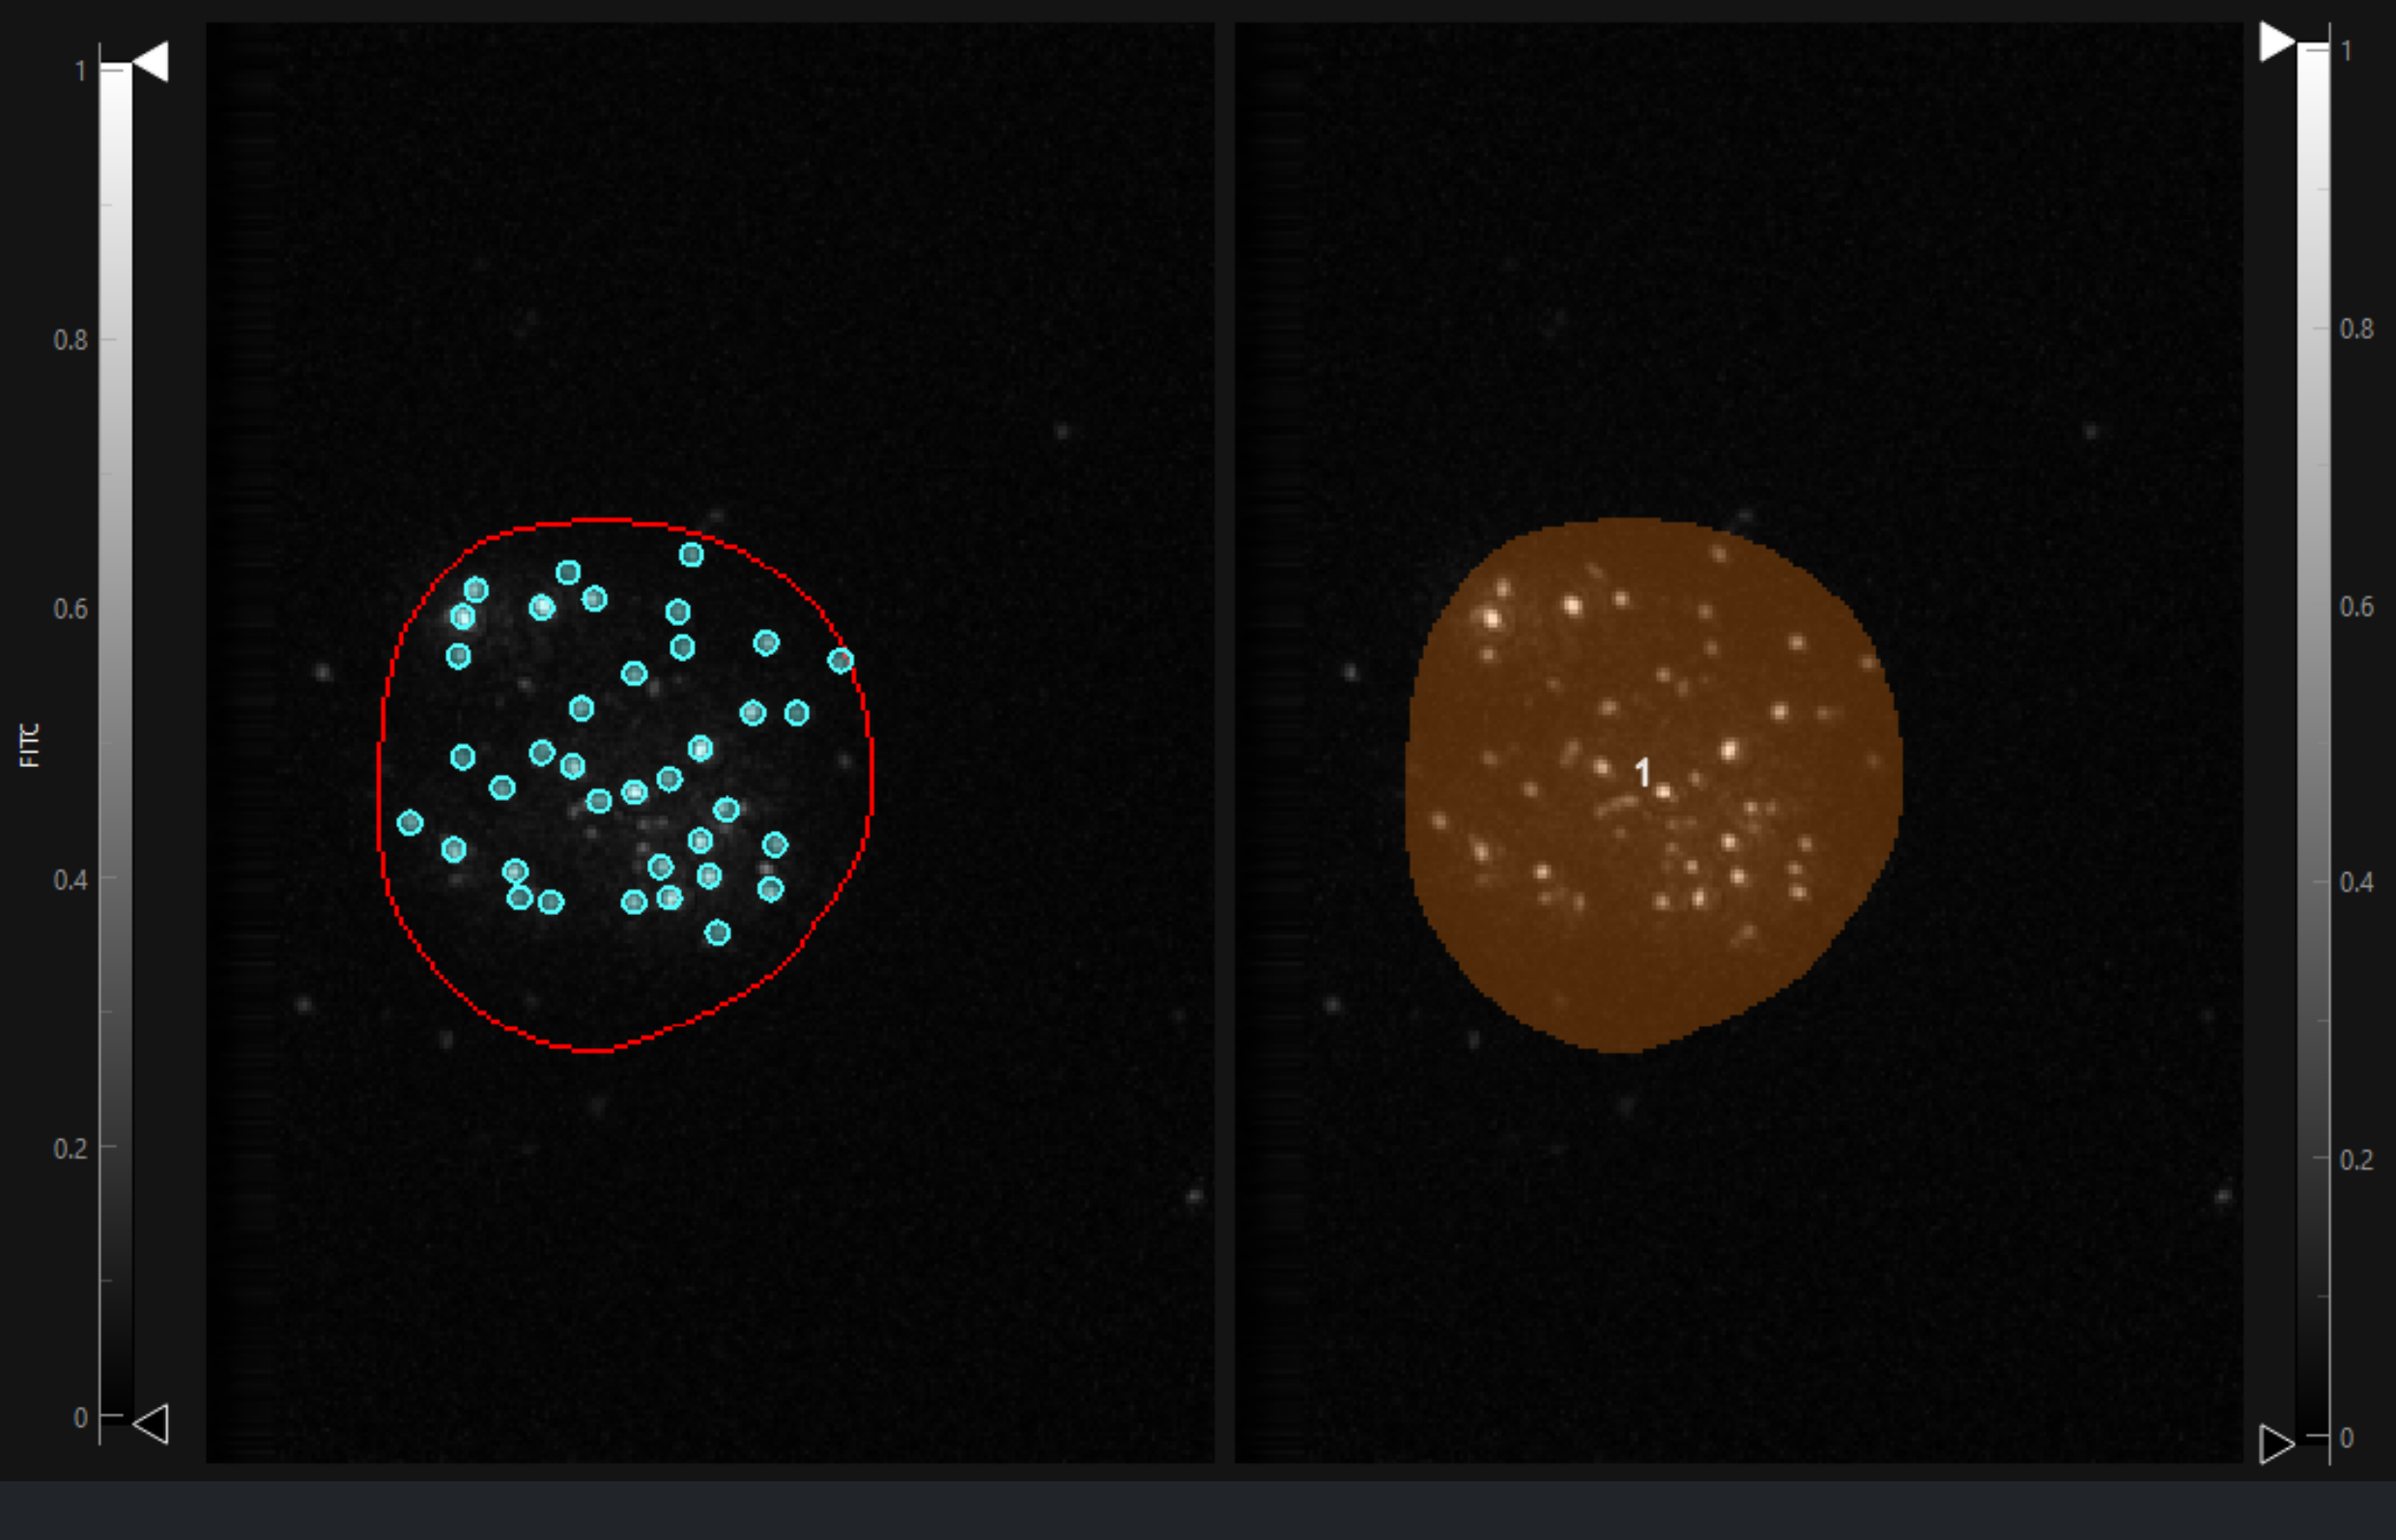
Count single-molecule of mRNAs in smFISH data
Optimised for high spot density
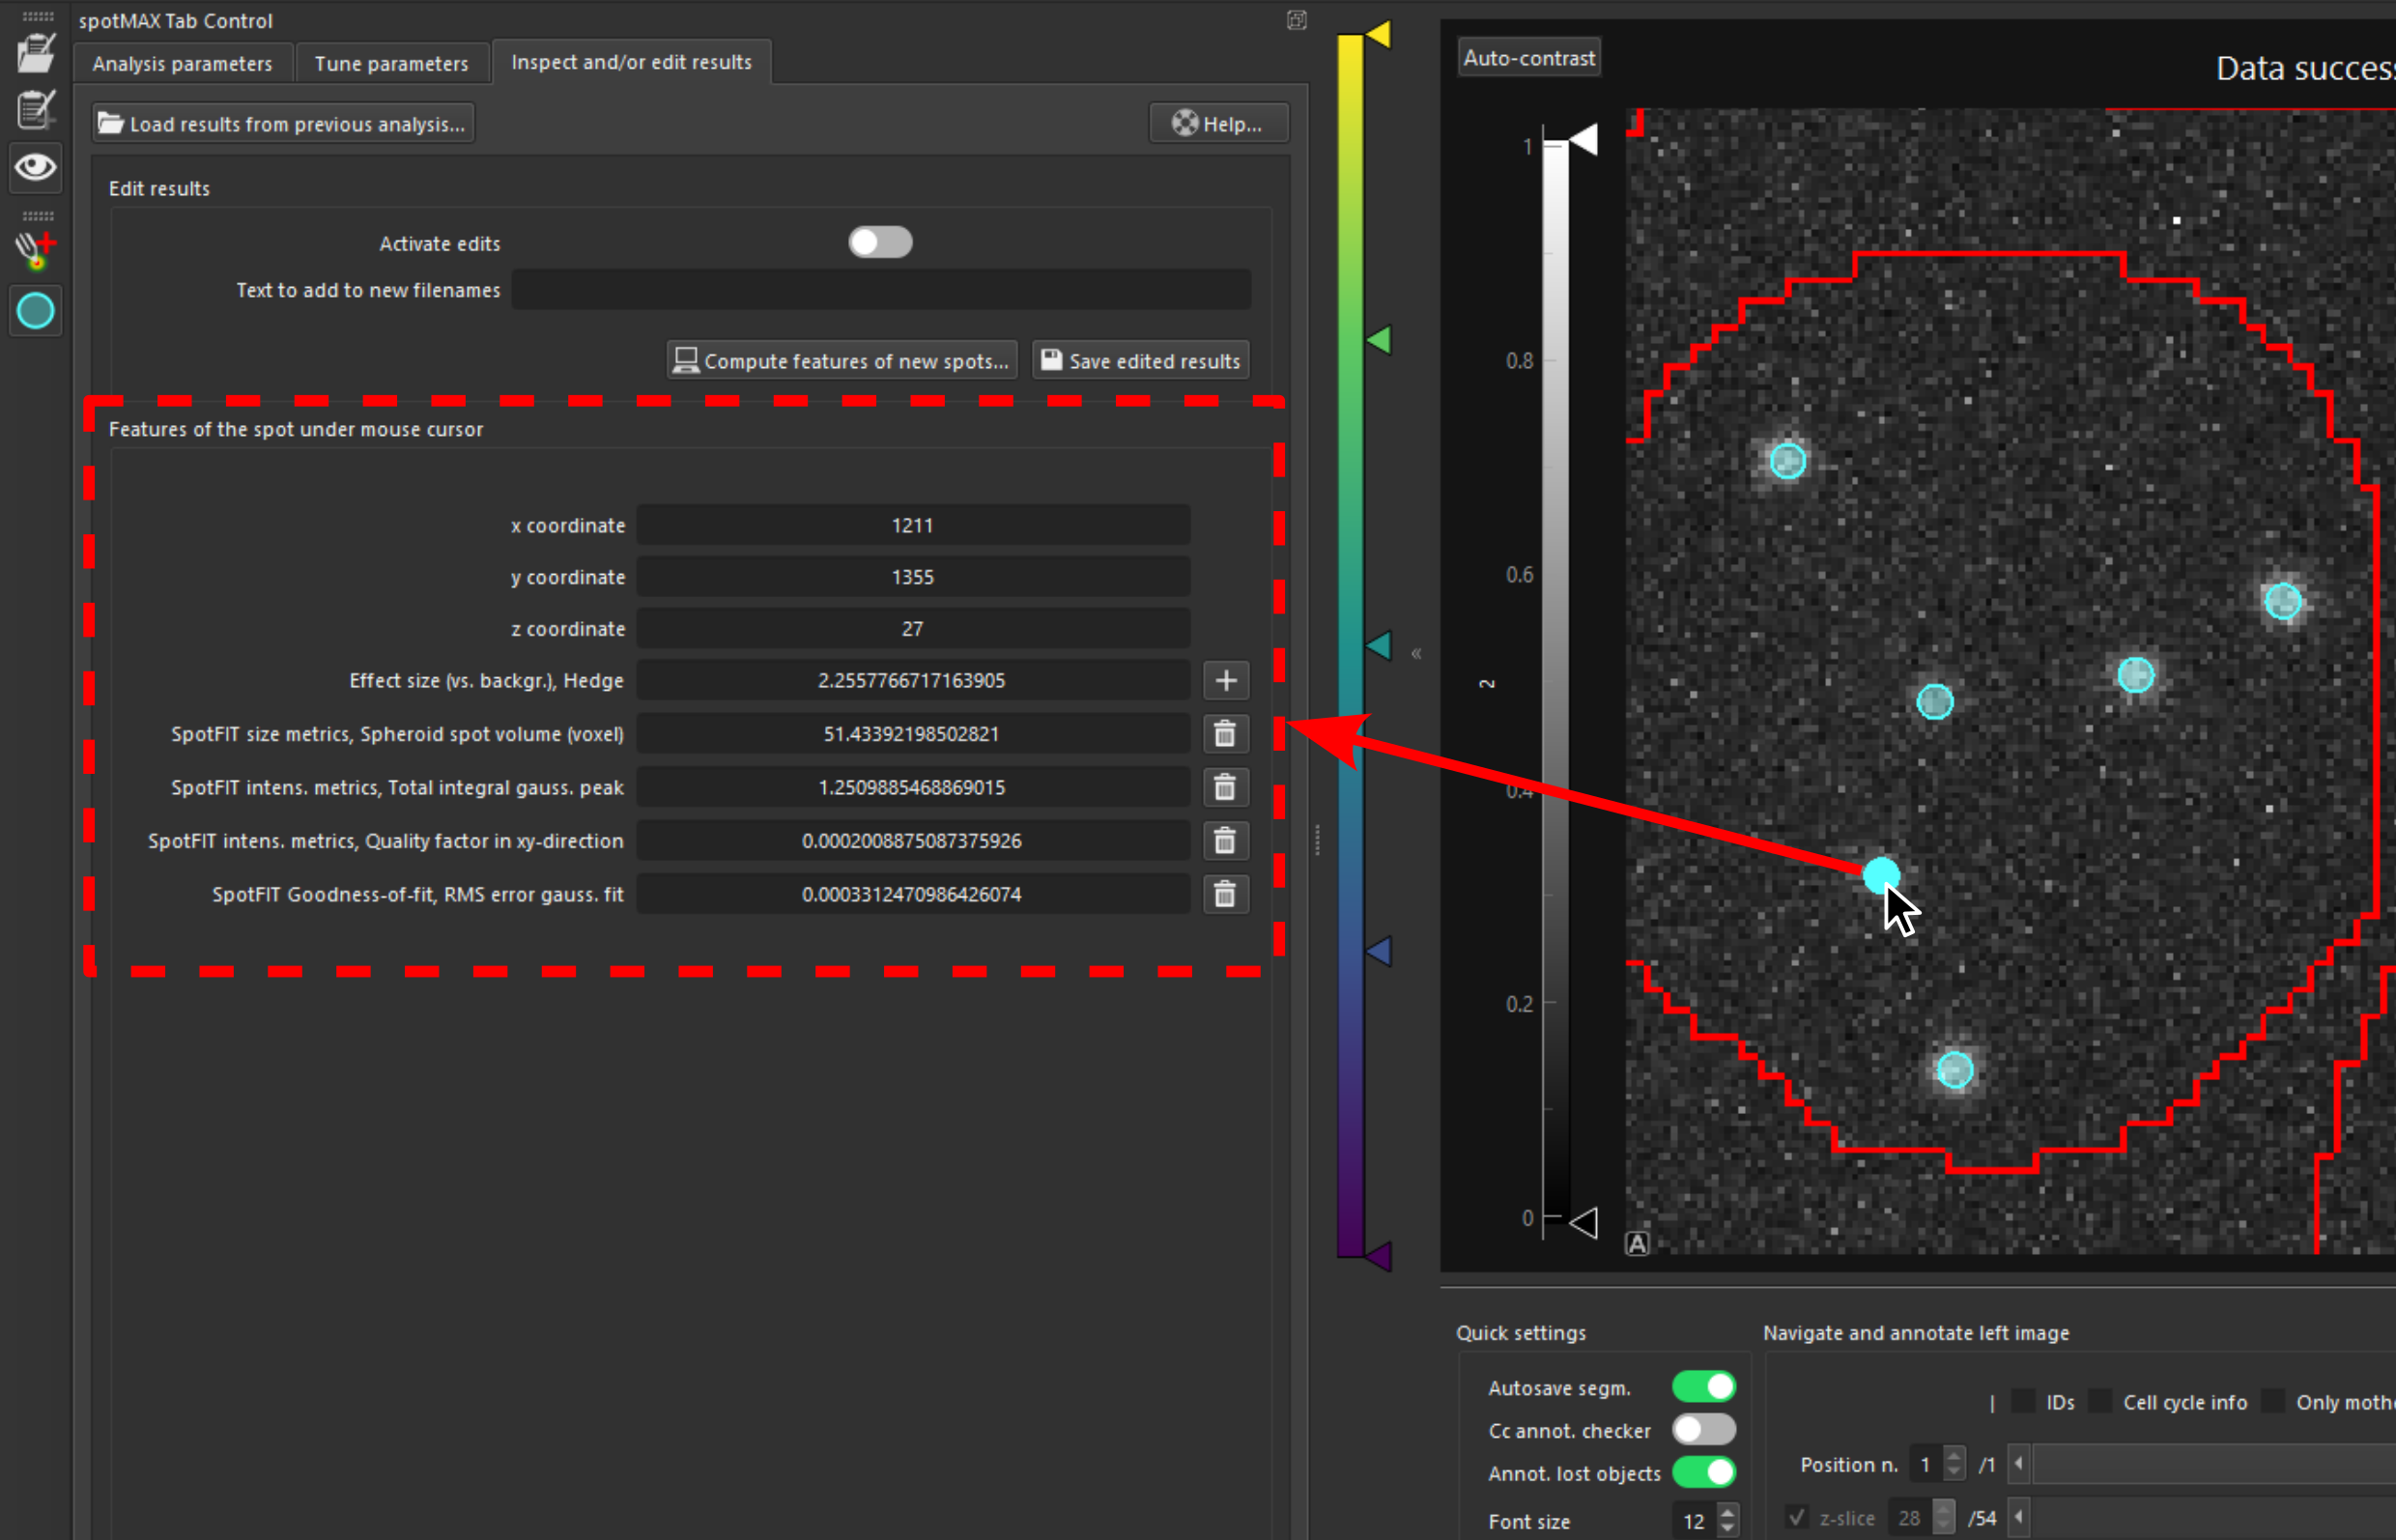
Inspect the results
Annotate detected spots and inspect features by hovering on the spot
SpotMAX excels in particularly challenging situations, such as low signal-to-noise ratio and high spot density.
It supports 2D, 3D, 4D, and 5D data, i.e., z-stacks, timelapse, and multiple fluorescence channels (and combinations thereof).